
There has recently been a general election here in the UK, this is the election that determines who is a member of parliament (MP) in the house of commons. There are 650 such MPs but four of them are Sinn Fein – people in northern Ireland who refuse to acknowledge the rule of London. Those Sinn Fein MPs win their elections but then refuse to show up in London and make decisions (and I respect their right to do so) which means it is effectively a battle over 646 seats, so whichever party or coalition of parties can control more than 323 seats forms the government.
The seats are decided on individually – the UK is split up into 650 constituencies with approximately the same number of people living in each, apart from where geography makes that impractical. In each constituency the party with most votes gets the MP, a system called first past the post. A lot of people don’t like this – imagine that everywhere 49% of people voted for purple and 51% of people voted for green, there would be 650 green MPs and zero purple MPs, which seems very silly, but there we are, that is the system and that is a separate conversation.
The result was quite surprising to many, in that we were all expecting there to be no overall control by one party, it was thought there would be an approximately equal percentage split between the two leading parties – Labour and the Conservatives, just look at this poll taken on the evening before the election.

Poll of polls night before election
The prediction was that this wouldn’t translate into an equal number of MPs on both sides, because of the first past the post system there would be significantly more Conservative MPs than Labour MPs, but most people thought no-one would have enough MPs to form a government. What actually happened was quite different, the conservatives won 331 MPs, not a large majority, but a majority nevertheless.
I was surprised by this and I wanted to look at the numbers in slightly more detail. I got all the numbers from a wonderful website called http://www.electoralcalculus.co.uk. In particular I was interested in the effect of two smaller parties who took more votes in this election than in previous elections – an environmental leftist party called the Green party and an anti-EU right wing party called UKIP. Many Labour voters were disillusioned with the Labour party and voted Green. The standard lore was that many Conservative voters voted UKIP, but actually a lot of lower income people who would normally have voted Labour also voted UKIP because they are worried about the effect of immigration on jobs and welfare, and they blame membership of Europe for this, since one of the aspects of being a member is opening your country to the free movement of citizens.
There are many very complicated things which could be done to the numbers to try to understand what the effect of these two parties are but I don’t have time to try them. However I wanted to see what would happen if all the Green voters had instead voted Labour. This is a misrepresentation of what would happen if the Green party didn’t exist since the environmental vote is wider, but I think perhaps most Green voters were Labour voters who wanted what they perceived as a more genuinely left wing alternative. The following table shows what happens:-

Effect of redistributing votes from Green and UKIP to Labour and Conservatives
If in every constituency you imagine that the Green party didn’t exist and transfer all of those votes to Labour, you do stop the conservatives from getting an immediate majority, but they would easily have found someone to go into coalition with such as the Democratic Unionists from Northen Ireland (who don’t appear in my tables, apologies) and possibly the Liberal Democrats. Also, of course, not all Green voters would be labour, I expect they picked up many Liberal Democrats.
In the same table I have plotted what would happen if all the UKIP voters voted conservative – a MASSIVE conservative majority. If all the UKIP voters had voted Labour which is extremely unlikely then Labour would still have had no majority but would have safely formed a government with the SNP. If the UKIP votes were split 50/50 between Labour and Conservative then not a lot would have happened.
I am well aware that this is a poor simulation of the real effect but it will have to do for now – to look in more detail at these figures, I really need some more demographic information about constituencies such as average income and average age, also more time than I have! However, I did notice one thing, and that was that voter turnout was significantly higher in constituencies where the Conservatives won. Look at this figure:-

Logarithm of the number of Con. votes divided by number of Lab. votes vs. voter turnout
I took the conservative vote and divided it by the Labour vote. So anywhere mainly conservative would give a number between one and infinity and anywhere mainly Labour will give a number between one and zero, which is not fair, so I took the logarithm, so that anywhere more conservative would be positive and anywhere more lab our would be negative. I plot this against voter turnout. To my eye there is clearly an upward trend, but of course we shouldn’t just use our eyes in science, we should measure something, so I evaluated the correlation coefficient which we usually call ‘r’. If there was no correlation, then r=0. If its a straight line going up then r=1, if its a straight line going down, then r=-1. Here we have an upwards cloud, with a correlation coefficient of r=0.55 so there is definitely an effect. However, how can we try and work out the magnitude of this effect upon the election result?
I decided to take the N most Conservative constituencies and compare the average voter turnout in those N to the voter turnout in the N most Labour constituencies. But then I couldn’t decide what was fair and unbiased to choose for the number N, so I did it for all N. Of course if N is small you will get the biggest effect and if N includes all 632 mainland Constituencies you will get zero. Here is the plot:-

Average percentage increase in voter turnout in N most Conservative seats relative to N most Labour seats. I show all N
So as we go down to the low N we are really comparing VERY Conservative seats with VERY Labour seats so we should get a cleaner signal. Again this is biased by the fact voter turnout would be lower in safe seats, so the effect could be even bigger than what I am about to estimate. I don’t have a lot of time, so I’ve decided it starts to stabilise around 15% as you reduce N and then below about 50 seats it just gets noisy. Pretty Arbitrary but that’s what I reckon. So I’m going to multiply the Labour vote nationally by 1.15 to estimate what would happen if the Labour Party could get their supporters to turn out and vote like Conservatives. This is what happens:-
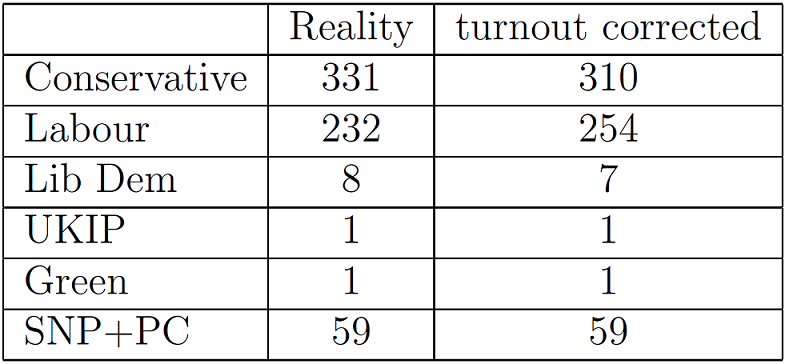
results corrected for poor Labour turnout
So they would have stopped the Conservatives from winning an outright majority, l think it would have been difficult for both sides to form a government in this situation. David Cameron would have argued that he had more of a mandate to do so, and he probably would have been right, but it would have been a much much weaker, fragile government than the relatively stable one we see today, which can survive quite a few by-elections.
Why do the Tories (Conservatives) turnout to vote more? Well a lot of them are old age pensioners which is certainly very important. Then one can start talking about free-time, car ownership, education, weather, disenfranchisement with the entire system and things like this, but I’m not a sociologist so I’ll stop here for now.
So what have we learnt?
- Green voters could have changed the result slightly in favour of the Conservatives but even if they all voted Labour, David Cameron would be in Westminster as a very powerful partner in a coalition.
- The huge number of votes bled to UKIP by both parties could have changed things a great deal, but one needs to know not only the % swing overall to UKIP but analyse things with a demographic model, which I don’t have time for.
- Lower Voter Turnout of Labour Party supporters was a bigger effect than the votes lost to the Green Party and if addressed could have caused real problems for Cameron.
feel free to criticise my naive analysis
