
Written by Elvi Haaramaki and Sof Hachem
Star clusters
In this project, we are looking at objects called star clusters, which are groups of stars that are gravitationally bound together. There are two types – globular clusters and open clusters.
Globular clusters are large collections of thousands of millions of red stars, most of which are population II stars formed a few million years after the Big Bang. The stars are densely packed together, and the shape of the cluster is roughly spherical1.

Open clusters are made up of a few hundred stars which are much less densely packed together than globular clusters, and are without a distinct shape. These stars are younger blue stars, tens of millions of years old, and are weakly gravitationally bound2. For this project we took pictures of M35, M36, and M37, which are all open clusters.
Open clusters are ideal for the purposes of the project, since the stars are further apart from each other, making them easier to resolve individually. This is necessary to be able to find the apparent magnitudes of the stars. Additionally, it is assumed that all the stars in the cluster are the same distance from us, allowing us to calculate the absolute magnitudes.

HR diagrams
HR diagrams are a useful tool in astronomy, as plotting stars within a cluster based on their magnitude and colour-temperature allows the study of the stars’ relative stellar evolutionary stages and provides an idea about the age and the relative distances of given clusters3, which was also the objective during the project.
For the data here, green and blue filters4 were used to attain the difference in the magnitudes corresponding to a colour index in the observational HR diagram, being plotted against the apparent (green) magnitude.
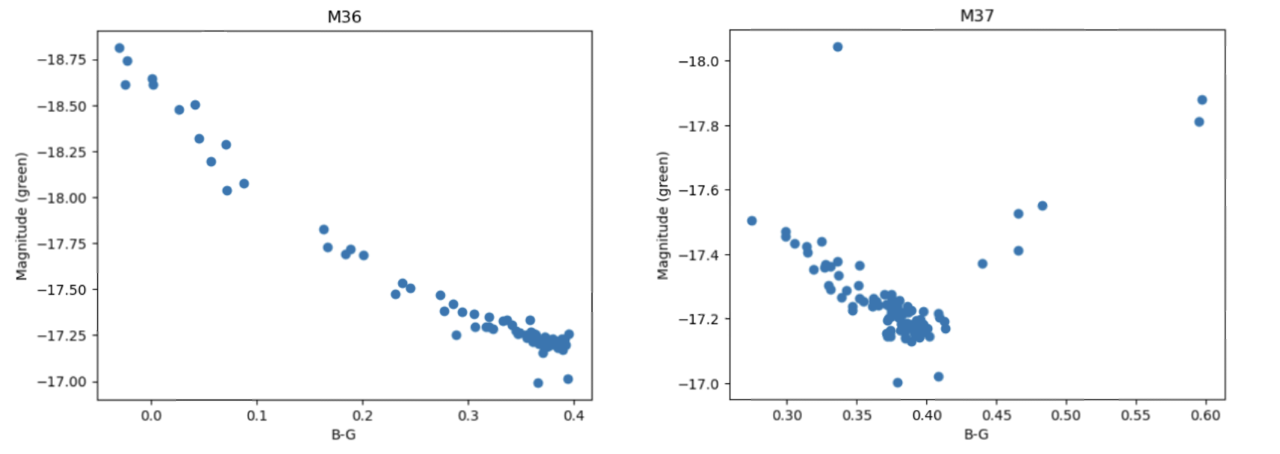
The upper left region in the diagrams corresponds to the bluer and brighter stars, while the redder and dimmer stars are located at the bottom right. The stars in a HR diagram for a relatively young open cluster, which mostly contains stars burning hydrogen into helium, are expected to lie along the main sequence branch – this is seen in the HR diagram for M36. In older clusters, the main sequence cut-off becomes more visible as the more massive stars burn hydrogen at faster rates and are consequently spending less time in the main sequence, leading older clusters to have more prominent red-giant branches. In globular clusters, more stellar evolutionary stages are present due to the clusters age, which can be seen in the HR diagram for M3.

Identifying the turnoff point from the diagram and comparing the mass and brightness of the most massive remaining star in the main sequence, allows us to further estimate the age of the star and – as stars within the cluster are estimated to have formed around the same time – the age of the cluster5.
References:
1: https://www.britannica.com/science/globular-cluster
2: https://www.schoolsobservatory.org/learn/astro/stars/clusters/openclus
4: https://www.astronomik.com/en/photographic-filters/deep-sky-rgb-colour-filters.html
3: https://en.wikipedia.org/wiki/Hertzsprung%E2%80%93Russell_diagram
5: https://www.scientificamerican.com/article/how-do-scientists-determi/
6: https://jila.colorado.edu/~ajsh/courses/astr1120_03/text/chapter4/l4S8.htm (Figure 6)
