
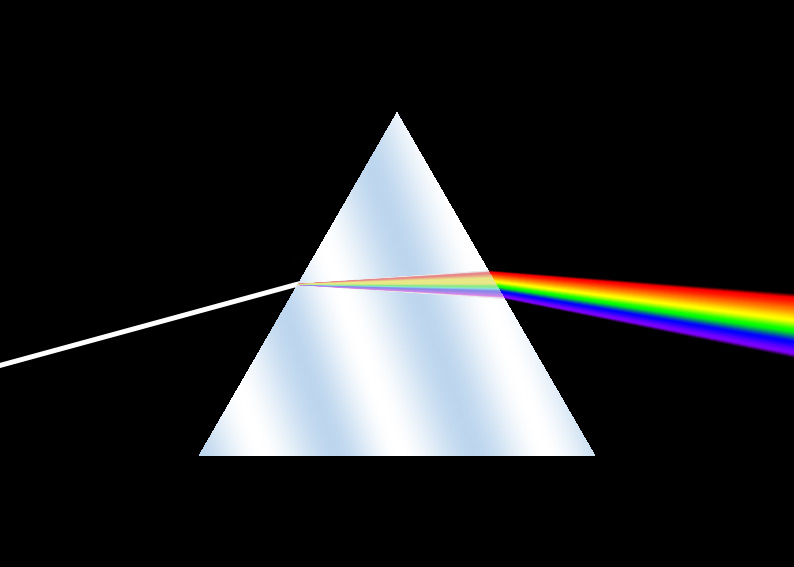
Those of you who have been paying attention to this whole telescope malarkey will know that one of the original goals of the project was to do spectroscopy. This is splitting light up into colours so that we can find out what something is made of. To quote Wikipedia, Newton applied the word “spectrum” to describe the rainbow of colors that combine to form white light and that are revealed when the white light is passed through a prism.
Rather than using a prism, we used a spectroscope, or spectrograph which we then projected onto our camera. Here is a picture of the spectrograph we bought

Here is the spectroscope we bought
So what can we do with this? We know that electrons orbit around atoms, right? Now because of quantum mechanics, electrons cannot just go in any orbits around atoms, but only specific energy orbitals. We also know that if they jump from one orbital to another, they either emit or absorb a particular quantum of energy in the form of a particle of light – a photon.
atoms absorbing and emitting photons of particular colours
Because that photon has a particular energy, it has a particular frequency which also corresponds to a particular wavelength which also corresponds to a different colour. In fact for a photon of light, the words energy, wavelength, frequency and colour are all different ways of saying the same thing. The more energetic a photon, the higher the frequency, the lower the wavelength and the bluer the colour.
The colours we see with our eyes make up the visible part of the spectrum and go from wavelengths of about 390 nm (short wavelength, high frequency, high energy) which corresponds to the colour violet to about 700 nm (long wavelength, lower frequency, lower energy) which corresponds to the colour red. A billion nm or “nano-metres” makes a metre. We have evolved to see these wavelengths/frequencies/colours because they are the only ones which can get through water and our eyes are mainly made of water.
Also, there is a lot of water vapour in the atmosphere, so what we can see with our eyes corresponds roughly to the colours which can get through from space. This is the reason we can see stars, given the effect those observations have had upon science, religion and philosophy the history of humanity would probably have been very different if we had not been able to see through the atmosphere. Anyway, I’m getting off topic.
Lets look at the following cartoon of electrons in the Hydrogen atom and the colour of the photons they emit or absorb when they jump between orbitals
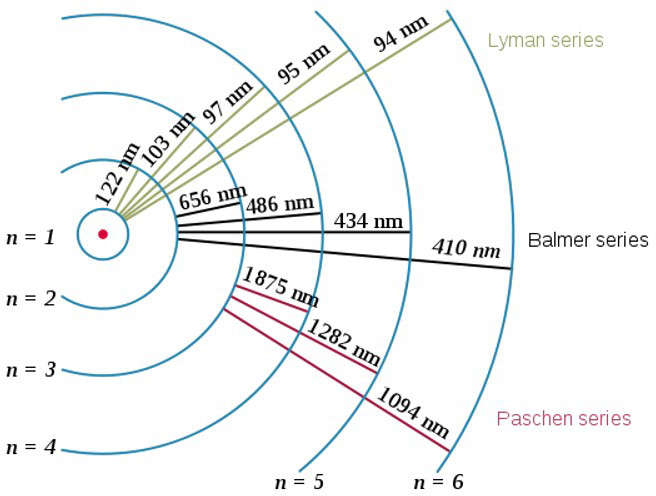
The jumps between electron orbitals in Hydrogen corresponding to the Lyman, Balmer and Paschen Series
The Lyman series are the jumps deep down into the lowest, most tightly bound orbit. They are the biggest, highest energy jumps so they correspond to very short wavelength photons, in fact these photons all have wavelengths less than 100 nm, so they are not visible light, they are beyond violet, so we call them (apologies if you are ahead of the game here) Ultra Violet.
The Paschen Series correspond to jumps to the third deepest orbit, which is much less tightly bound. These jumps all have energies/frequencies corresponding to wavelengths beyond 1000 nm, so they are redder than red, we can’t see them and we call them Infra Red. The jumps to the second n=2 orbit are called the Balmer Series and (like a scene from Goldilocks and the Three Bears – this porridge is too hot, this porridge is too cold etc…) they are just right. It’s for this reason the Balmer Series are so important for Earthbound Astronomy. We call the 3->2 transition Hydrogen alpha, 4->2 Hydrogen beta, 5->2 Hydrogen gamma etc.
So what can WE see when we point our telescope into space with the spectrograph attached? Lets look at the star Sirius:-
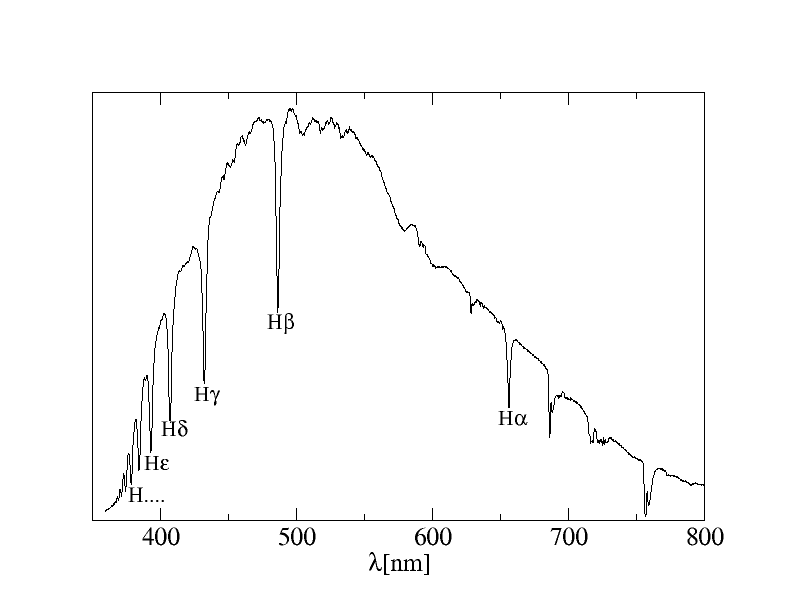
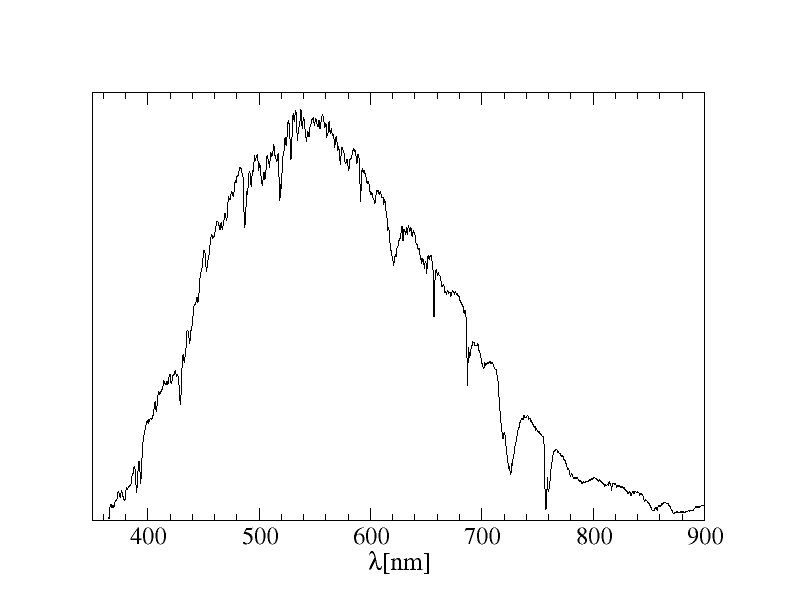
The spectrum of Sirius with the Balmer lines clearly visible
Like all the spectra on this page we got this from the roof of KCL in the middle of London with help from undergraduates as part of a third year project we ran between January and March. Well we can see lots of photons from 350 nm (violet), peaking around 500 nm (green) and going well beyond 700 nm (red) into the infra red region, which our camera can pick up. Now Sirius is actually a very blue star with lots of low wavelength violet and ultraviolet light coming from it, and our camera could pick up some of that too, but that doesn’t get past the water in the atmosphere, so from down here on Earth, Sirius looks more green than it really is.
What we are really interested in today however is the lines you can see in the spectrum – some of the radiation from inside the star gets absorbed by the Hydrogen in the outer parts of the star by exciting the electrons, but only at the particular wavelengths corresponding to the jumps between election orbitals. We can clearly see some other stuff, but for Sirius, the most obvious lines are the Balmer series which is probably what you would expect since stars are mainly made of hydrogen. These are absorption lines. We actually use the position of the lines to calibrate the horizontal axis, this calibration is not perfect but it will do for now.
So we have just established Hydrogen in the atmosphere of a star which is 82 thousand million million kilometres away. Taking pretty picture of stuff in space is just Astronomy, what we are doing now is proper Astrophysics. Thank Goodness for Newton and Quantum Mechanics!
When we look at diffuse gas like the Orion Nebula, we don’t see absorption lines but rather emission lines, this is because the gas surrounds very hot young stars which are still forming which heat up the gas and knock the electrons off the atoms. Every so often, when those electrons are recaptured, the gas emits a photon corresponding to that energy jump. Here is the spectrum we got:-
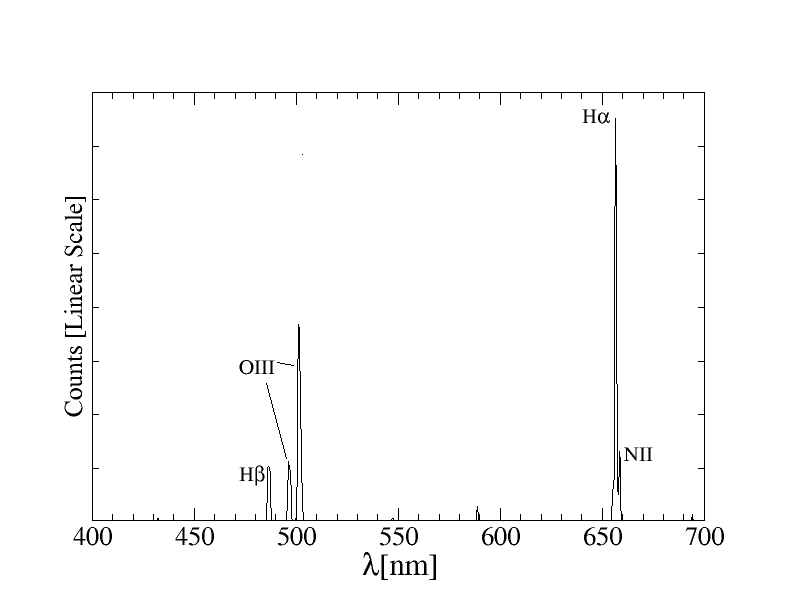
Emissions lines of Orion Nebula
And here it is with a log scale to bring out the details of some of the dimmer lines you can see, so we have at least two lines from the Balmer Series, but also oxygen lines, a Helium line and a Nitrogen line.
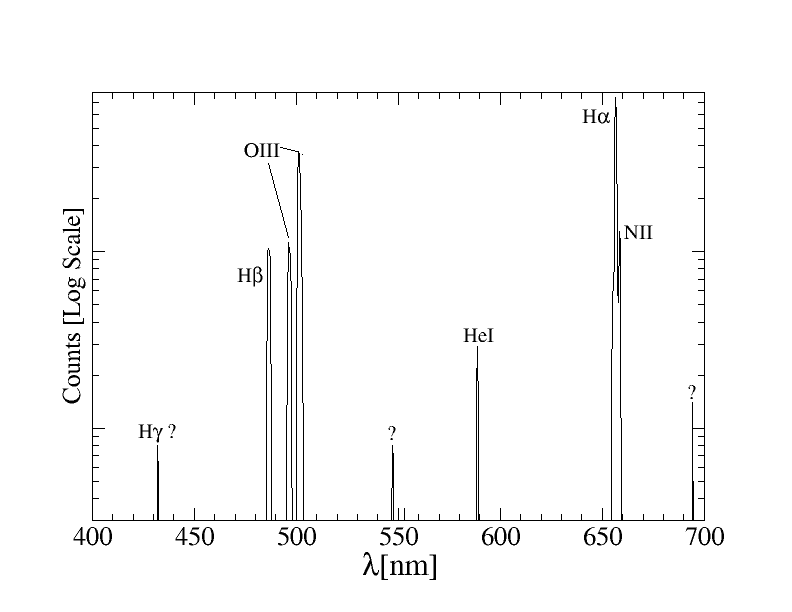
Emission Lines of Orion Nebula with a log scale
So lets now look at a planet. Planets don’t produce their own light, they just reflect light from the star closest to them. Of course for practical purposes for the planets we can see that means the Sun. Jupiter is a big bright planet that isn’t too far away So lets look at that.
Spectrum of Jupiter
Jupiter reflects the light that falls on it from the Sun, but it also absorbs some of that light. Jupiter contains molecules, which the Sun is far too hot to contain, they would break up in the intense heat. In particular, Jupiter has some methane (CH4) in its atmosphere and light with the correct radiation can get absorbed by those molecules, so then is not reflected back to us. It is in this way we can figure out what Jupiter is made up of. So lets zoom in on part of Jupiter’s spectrum

Detail of Spectrum of Jupiter, see text for colour coding
Here I have colour coded various lines. In red you can see the Hydrogen Alpha line, the significance of the red is that this spectral feature was in the original light from the sun. What I mean is that line of missing photons corresponds to those photons that were absorbed in the outer part of the Sun before that light went to Jupiter and then got reflected. You can also see in blue two oxygen bands which also appear in Sirius’s spectrum up at the top of this post. Well they will appear in anything we look at from down here because its light being absorbed by the oxygen in the Earth’s atmosphere, so the blue means a spectral feature due to absorption of photons in the Earth’s atmosphere. The two features colour coded orange are two bands of methane absorption, not narrow lines since the molecules can vibrate in lots of different ways. There isn’t any methane in the Sun as its too hot. There is very little methane on Earth, but there is some. However if this was an absorption feature from the methane on Earth, we would also see it in the spectrum from Sirius, which we don’t – there isn’t enough. So this methane is on Jupiter!
