This post is by Sunayana who has been helping me with the telescope over the past year. Unfortunately she is now leaving us to pursue an MSc in Astrophysics at UCL but I sincerely hope she will find time to come back and visit us up on the roof as often as possible.
One of the key purposes for the KCL telescope is its use within third year project work. Trialled in early 2015, the first set of project students used spectroscopy to analyse the composition of elements in the atmosphere of Jupiter, the Orion Nebula and Sirius. This involved grappling with raw images, plugging them into software and outputting a spectrum of intensities plotted against a range of wavelengths. In pursuit of a more efficient solution, a challenge was posed – to write concise image processing software which would take any greyscale image of emission/absorption lines and immediately convert it to its corresponding spectrum. This would circumvent the tediousness of cropping images manually and having to abide by the constraints of external software, allowing for flexibility and swifter analysis.
So immediately I got to work, contemplating the most suitable programming language for manipulating image files in a streamlined and precise way. Reluctantly turning away from my familiarity with FORTRAN 90, I embraced C for an easier ride into image manipulation.
The programme opens a grayscale bitmap chosen by the user and scans each pixel, processing its intensity value. Since these are 8-bit grayscale images, each pixel contains only intensity information and therefore has a value between 0-255 (2^8). Then, the intensity of pixels in each row for a given column is summed and plotted. So, going across the image, any detected non-zero intensity value for a given column will yield a peak in the spectrum. Proportionally, the larger the number of non-zero intensity pixels, the bigger the peak will be. An all-white vertical line across the image, for example, would have the maximum intensity possible. Of course, the non-zero intensity pixels represent the areas on the image where characteristic emissions are occurring (or vice versa for zero-intensity pixels where absorptions are occurring).
It is important to note that the intensity of each pixel is typically non-linear and discrete data analysis of an image which supposedly contained equal increases in intensity across its width was terribly unhelpful in the early stages of writing the programme. Finally, the number of pixels across the width of the image is calibrated according to the wavelength range of the spectroscope (between 300nm and 1100nm). Therefore, a spike identified at the 50th pixel of a 200 x 200 image, will translate approximately to a peak at the 500nm mark. Automatically, all the pixel data of the image is written to a readable, graphable text file which is easily plotted on any data analysis software including GNUPLOT, Xmgrace and Microsoft Excel. Hopefully, this swift and user-friendly method for image manipulation will serve the next cohort of third year undergraduates well. Watch this space…
More recently, we have been trying to ratify, more broadly, student access to the telescope in both an academic and extracurricular capacity. We’ll be instrumentalising the (optimistic) novelty of a telescope on a rooftop in central London through termly events, titled ‘A Night on the Roof,’ where undergraduates will be able to attempt to find and focus on solar system and/or deep sky objects according to visibility. This will hopefully be the first of many streamlined operations to allow wider access to the work being undertaken at the telescope. Later we may have a series of public lectures on astrophysics and related themes, which might feature a live-feed from the telescope as an additional bonus.
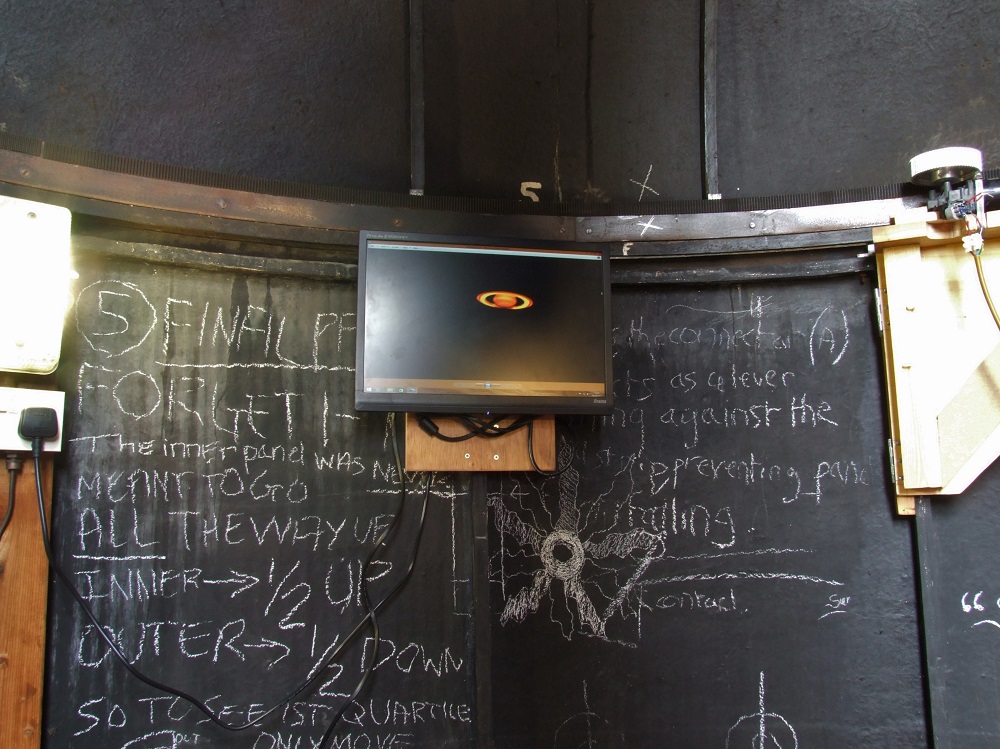
We have been attempting to make the dome rotation smoother and now there an additional monitor has been mounted to the wall inside in the dome so we can have the computer in the hut but still work in the dome (see below).